
Argentina’s apparent decline during the twentieth century is more likely an illusion created by faulty GDP statistics.
Recently the Economist published a front-page feature on ‘The Tragedy of Argentina: A Century of Decline‘. By summarising the current scholarship on the ‘Argentine paradox’, the article demonstrates why the study of the country’s history remains so necessary.
The article begins with the standard claim that Argentina was rich at the beginning of the twentieth century:
‘The country ranked among the ten richest in the world, after the likes of Australia, Britain and the United States, but ahead of France, Germany and Italy. Its income per head was 92% of the average of 16 rich economies’.
To illustrate what happened next, the Economist provides a graph of Argentina’s GDP per capita relative to eight individual countries and the average of 16 OECD countries during 1900-2010. The source for these numbers is the Maddison Project, a research group dedicated to continuing the late Angus Maddison‘s project of producing GDP estimates since the year zero.
Maddison’s own GDP estimates for Argentina illustrate why the Economist‘s series should be treated with a considerable degree of scepticism. Table 1 reproduces his various estimates of the GDP per capita of Argentina and various other countries in 1913, with all referenced so that Britain equals 100. As can be seen, there is considerable variation in Argentina’s relative GDP levels from one iteration to another of Maddison’s database.
Table 1
International GDP per capita in 1913
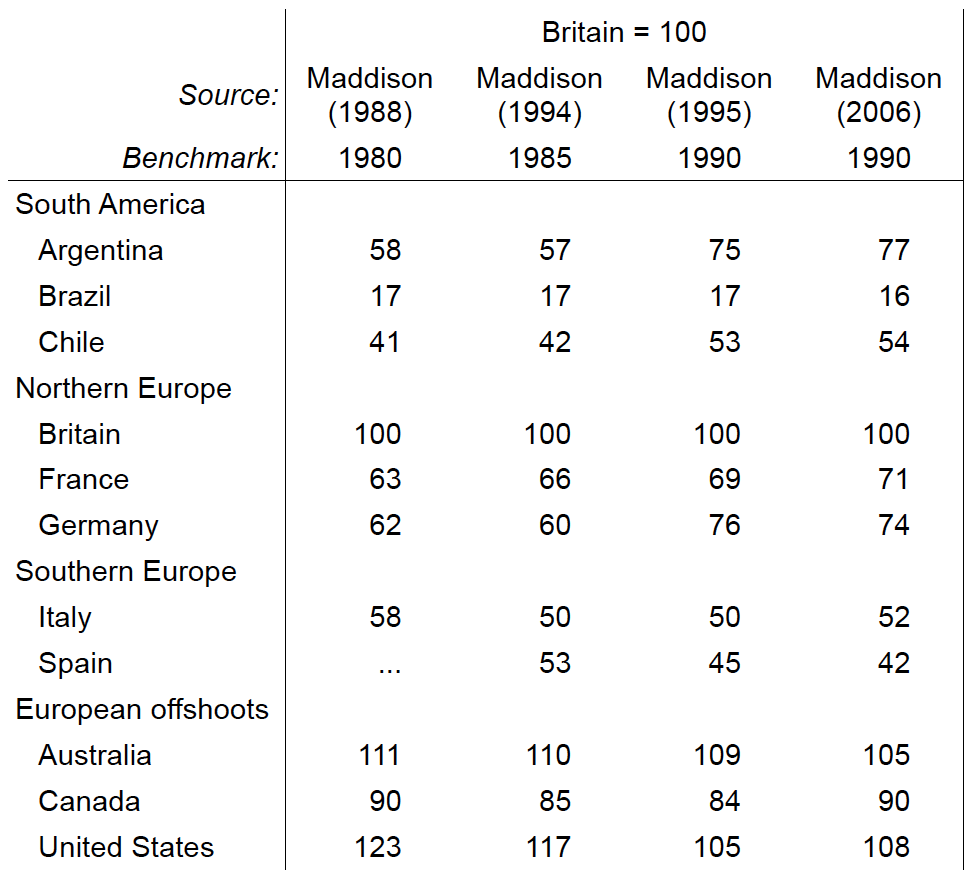
Note: The figures show the country’s GDP per capita in 1913, referenced so that Britain equals 100. The benchmark refers to the PPP estimate from which the series are extrapolated backwards.
Sources: Maddison (1988, p. 19, Table 1.3; 1994, p. 22, Table 2.1; 1995, Table 1-3; 2006, II, pp. 438-39, 445, 466, 520, Tables 1b, 1c, 2c, and 4c).
The most striking comparison comes from the first and last versions of his database. In 1988 Maddison reckoned that Argentina’s GDP per capita in 1913 was 58 percent the level of Britain. According to this measure, then, Argentina was at the same level as Italy, one of the countries of Europe’s poor southern periphery. It was also behind France and Germany. By 2006, however, Maddison had decided that Argentina was way ahead of these countries in 1913: its GDP per capita was 77 percent of Britain – fully 25 percentage points ahead of Italy, and also leading France and Germany.
This dramatic transformation in Argentina’s fortunes from Maddison (1988) to Maddison (2006) appears to have been due to the addition of the informal sector to the 1990 base year. Maddison (1995, p. 143) wrote:
‘A major problem with the national accounts of Latin American economies is the assessment of activity in the informal sector. Recent official revisions for Argentina have been very substantial. Instead of a GDP totalling 2 830 million australes in 1980, it is. now estimated to have been 3 840 million (nearly 36 per cent higher)’.
Based on this statement, the logical explanation of how Argentina in 1913 became so much richer from one Maddison to the other is that toward the end of the twentieth century the Argentine government made an adjustment to its official GDP series to take into account the growth of the informal sector. To understand why an adjustment to Argentina’s late twentieth-century GDP would affect Maddison’s estimate for 1913, it is necessary to revisit the steps in his calculations.1 They are:
- He begins with an estimate of nominal GDP in US dollars in his more or less recent base year.
- He adjusts that estimate for differences in the price level, in order to arrive at an estimate in international purchasing power parity (PPP) dollars.
- He extrapolates backwards from that recent PPP base-year estimate using a volume index of the country’s historical GDP.
Bearing these steps in mind, it seems likely that Maddison adjusted his Argentine GDP series by adding the informal sector to his base-year GDP estimate (step 1), adjusting by the same price level (step 2), then extrapolating back using the same volume index (step 3).2
Crucially, then, Maddison’s historical GDP statistics will only be as reliable as his underlying figures for the base-year nominal GDP, the base-year price level, and the volume index. The problem with his estimates for Argentina is that the base-year nominal GDP has been adjusted for the growth of the informal sector, but the volume index has not. Hence, he has extrapolated back from the adjusted base-year estimate using an identical volume index. This is fatal for Maddison’s calculations because the informal sector grew disproportionately, which is precisely why the government felt the need to adjust its official GDP estimates toward the end of the twentieth century.
Even as the ‘Argentine paradox’ literature was exploding the 1980s, Adrían Guissarri (1989, ch. 4) was already asking the question of whether his country’s apparent decline was actually an illusion generated by the disproportional growth of the informal sector. Using a methodology developed by Vito Tanzi (1983),3 Guissarri estimated that the informal sector grew at a trend rate of 5.9 percent per year during 1930-85, whereas the formal sector grew at 3 percent per year; combined, the overall growth rate was 3.6 percent.
In Figure 1 Guissarri’s volume indices of GDP with and without the informal sector have been used to produce Maddison-style historical GDP estimates for 1930-85, this time shown relative to the United States. The result is striking: the unadjusted series produces the standard ‘Argentine paradox’ narrative, as Argentina’s GDP per capita fell from 60 percent the US level in 1930 to 37 percent in 1980; the adjusted series tells a quite different story, however, as there is no decline over this period, with the Argentine level staying roughly constant vis-a-vis the US level.
Figure 1
Argentina’s GDP per capita, 1930-85
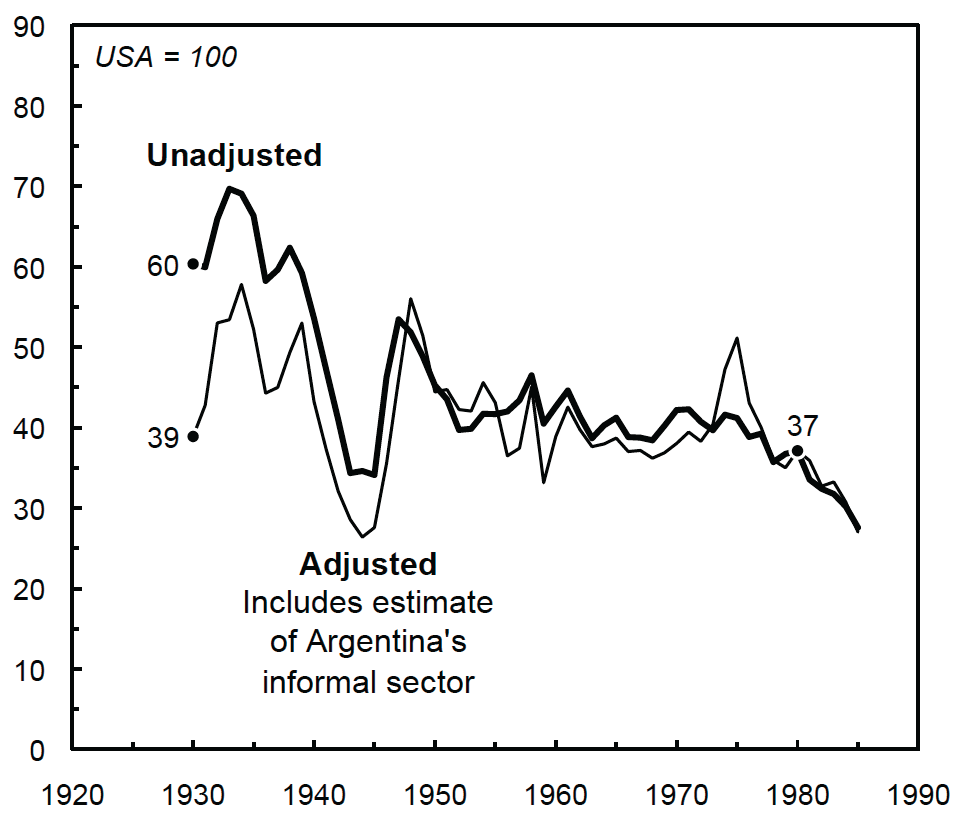
Note: The GDP per capita of both Argentina and the United States were calculated by using volume indices to extrapolate from GDP per capita in international dollars in 1980.
Sources: 1980 benchmark GDPs: Maddison (1988, p. 112, Table A-1). Argentina’s formal and informal GDP: Guissarri (1989, ch. 4, Cuadro 13). US GDP and populations: Maddison (2006, II, pp. 460-61, 463-64, 500-01).
From this perspective, much, if not all, of Argentina’s apparent decline during the twentieth century was actually due to the process of urbanisation: as the population shifted to the cities, the government proved unable to measure the growth of the urban services that represented the bulk of the ‘informal sector’; consequently, it underestimated the extent to which GDP as a whole grew; the volume indices used by Maddison et al then resulted in overestimates of past GDP levels, which Maddison appears to have then compounded when he adjusted his base-year GDP for the presence of the informal sector, without taking into account that it had grown disproportionately over time.
The case of Argentina in this way demonstrates the margins of error in historical statistics. As was discussed in my previous post, a defence that has been offered is that the margins of error are not sufficient to significantly affect the analysis – Argentina clearly demonstrates, however, that this is not the case. More plausible is the argument that only through the use of bad numbers will it be possible for better numbers to be found (Middleton 1991). In the case of Argentina, this would involve building on Guissarri’s work to produce a better GDP volume index that would include both the formal and the informal sectors. Without that data, it is impossible to say if or when Argentina declined.
References
Guissarri, A.C., La Argentina informal: Realidad de la vida económica, Buenos Aires, 1989.
Maddison, A., The World Economy in the 20th Century, Paris, 1988.
_____, ‘Explaining the Economic Performance of Nations, 1820–1989’, in W.J. Baumol, R.R. Nelson, and E.N. Wolff, eds., Convergence of Productivity: Cross-National Studies and Historical Evidence, Oxford, 1994, pp. 20-61.
_____, Monitoring the World Economy 1820-1992, Paris, 1995.
_____, The World Economy, I and II, Paris, 2006.
Middleton, R., ‘Mickey Mouse Numbers in World History: The Short View by D. C. M. Platt’, English Historical Review, 106:421, 1991, pp. 1079-80.
Tanzi, V., ‘The Underground Economy in the United States: Annual Estimates, 1930-80’, International Monetary Fund Staff Papers, 30:2, 1983, pp. 283-305.
Footnotes
- As will be detailed in future posts, this methodology was pioneered by economists working at the University of Pennsylvania, in their Penn World Table project. It can therefore be referred to as the ‘Penn methodology’. ↩
- The process was slightly more complex as Maddison converted his 1980 PPP base year to a 1990 PPP base year for his 1995 and 2006 estimates. ↩
- The methodology is based on the assumption that there is a normal demand for money that is determined by formal activity, the interest rate, and inflation. Regressions are then used to calculate how far the money supply is beyond the level of demand suggested by those indicators, which is then taken as a sign of informal activity. Guissarri (1989, Cuadro 17) also provides an estimate based on electricity usage, which provides a similar result to this monetary method. ↩
Pingback: Economic History Link Dump 15-01-2015 | Pseudoerasmus
Joe, very interesting! For the database of our book with Pablo Gerchunoff “El ciclo de la ilusión y el desencanto” we faced this very problem, I remember every solution seemed arbitrary. I think we distributed the “informal surplus” as coming only from post-1960 growth. I’m going to check.
Hi Lucas,
In your introduction to the draft version of Exceptional Argentina you state that it doesn’t make much difference to the backward projection for 1900, so I’d be curious to see your methodology.
I’d suggest that the ‘informal sector’ has been growing disproportionately since before 1960, as it was a result of the growth of urban services.
An interesting exercise would be to apply Guissarri’s methodology to the whole twentieth century.
Lucas says not to worry, that he estimated that the final value is only modified in a confidence interval of 10% (+-2). Just the same as when he was in charge of coordinating the country’s monetary policy.
Pingback: La libertad retrocede. Crítica de la plataforma electoral mileiana – Eloy Cavallaro